
The Keystone Oscillator II is designed to provide a visual indication of momentum by combining a number of algorithms. The greater the histogram whether positive or negative is one indication of momentum strength. The brighter the color of the histogram is another indication of momentum strength. The points at the zero line are yet another indication of momentum. A green zero line point is an indication of positive momentum while a red color would indicate a negative momentum.
When all of the algorithms are supporting the same momentum you will typically experience a trend. Once one of the momentum algorithms begins to weaken it may signal the trend is ending.
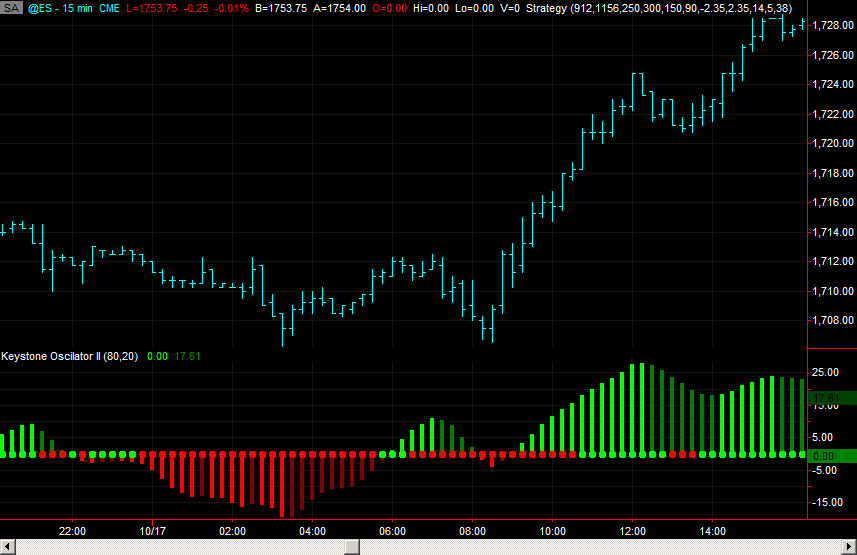
In the example below you will see how there was modest down trend at the beginning of the chart. The indicator is showing the momentum is negative, however not near as strong as the momentum towards the end of the example.