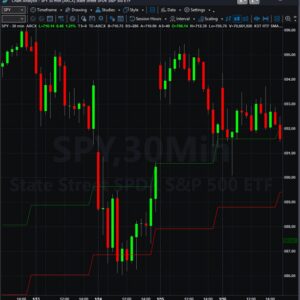
KST Divergence Indicators
$19.99 / month
Maximize your trading precision with the Divergence Indicators Suite, a powerhouse trio designed to spot trend reversals before they happen. By combining the most reliable momentum oscillators—RSI, Stochastic , and MACD—this toolkit identifies “hidden” price action where momentum and price disagree.
- RSI Divergence: Pinpoint Exhaustion. Capture overbought and oversold extremes to find high-probability reversal zones.
- Stochastic Divergence: Perfect Your Timing. Use smoothed data to filter out market noise and nail your entry and exit points with surgical accuracy.
- Includes Fast, Slow and Double Slow Stochastics.
- MACD Divergence: Confirm the Trend. Leverage the strength of moving average convergence/divergence to validate long-term shifts in market sentiment.
Stop chasing the market and start anticipating it. Whether you are a day trader or a long-term investor, these indicators work in harmony to provide a clear, objective edge in any market condition.
Description
Learn more about the KST Divergence Indicators
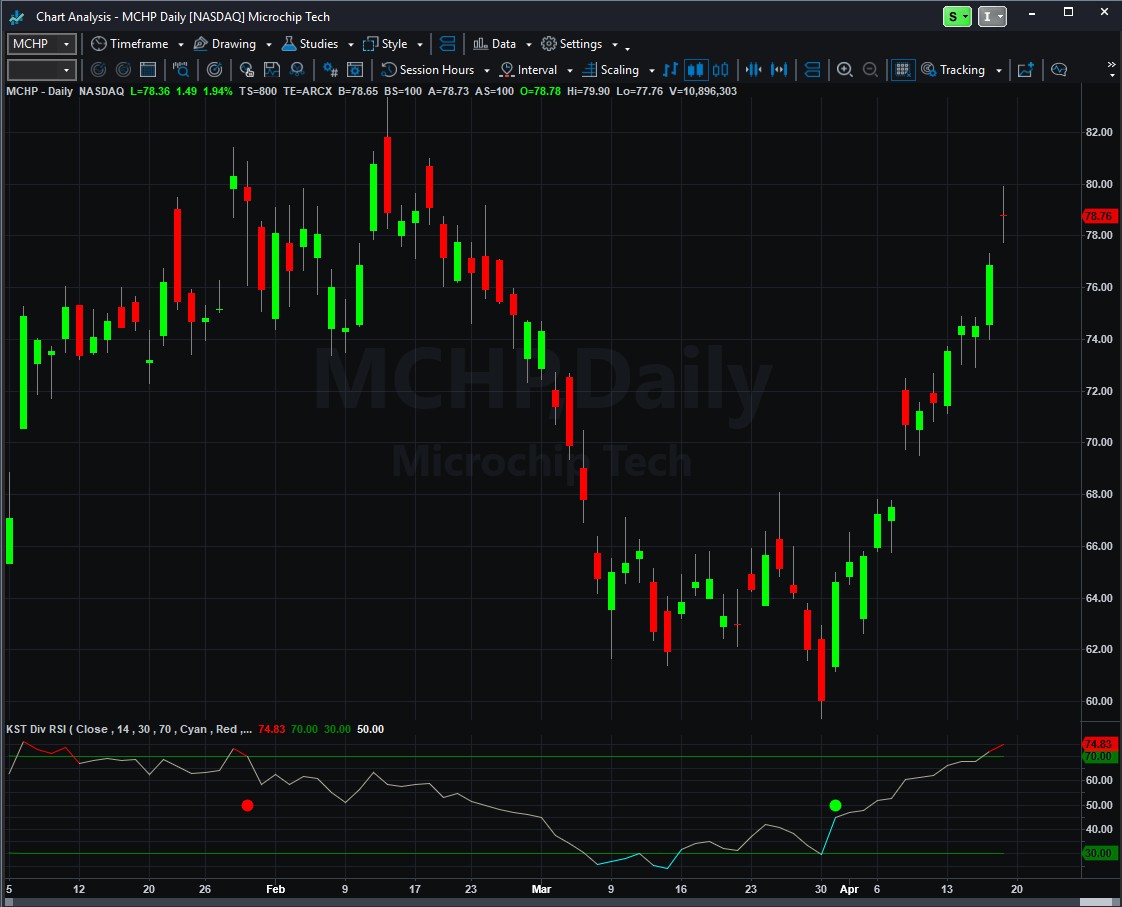
To identify these patterns, you’re looking for a “disconnection” between price and the indicator. When they stop moving in the same direction, a reversal is likely brewing.
1. Bullish Divergence (The “Buy” Signal)
This occurs when the market is in a downtrend, but selling pressure is fading.
- Price: Makes a Lower Low (the price drops further than the previous dip).
- Indicator (RSI, Stochastic, or MACD): Makes a Higher Low (it fails to drop as far as it did before).
- What it means: Even though the price is cheaper, the downward momentum is actually weakening. Think of it like a car rolling downhill but starting to press the brakes.
2. Bearish Divergence (The “Sell/Short” Signal)
This occurs when the market is in an uptrend, but buying power is exhausted.
- Price: Makes a Higher High (the price climbs above the previous peak).
- Indicator (RSI, Stochastic, or MACD): Makes a Lower High (it peaks lower than the previous time).
- What it means: Buyers are pushing the price up on “fumes.” The lack of matching momentum suggests the trend is about to snap and head lower.
Pro Tips for the Suite:
- RSI & Stochastic: Best for spotting these patterns in range-bound or sideways markets where levels are overextended.
- MACD: Best for spotting these patterns in strong trends to see if the overall “engine” of the move is losing steam.
- The “Triple Threat”: If all three indicators show divergence at the same time, it is considered a high-conviction signal.